

This post represents the renewal of a blog series dating back to 2013. Four times between 2013 and 2019, we looked at a batch of grants that had recently closed — anywhere between 22 and 54 of them — to ask the question: Are we making effective grants? A resulting blog post assessed the overall success of the grants and what kind of an impact they might have had on the grant recipient’s organization, the target population, or the broader field. We put this grant assessment on hold in the aftermath of the Covid-19 pandemic. During the pandemic, we gave our grant partners the option of repurposing grant dollars for whatever needs they prioritized, and suspended grant reporting requirements. The performance data just wasn’t there for a while.
Since the pandemic, we have brought back reporting requirements and recently reached a reasonably critical mass of 44 closed grants. When some of our newer Trustees asked us how we evaluated our own grantmaking, we decided to reboot the evaluation process. These grants are mostly from our Programs & Services grants portfolio, with a few Community Change grants in the mix.
When a Program Officer closes out a grant, they complete an internal assessment form that is associated with the final report. Drawing on site visits, interim reports, final reports, and the relationships we build with grantees, we respond to this question: Were overall grant objectives met? We looked at the objectives that the grantee had described to us when they applied for funding. The scoring options include Fully Met, Mostly Met, Partially Met, Not Met At All.
Just to give you an example of what these objectives might look like: an agency may have shared with us its intention to roll out a mental health intervention to some number of new clients annually, or to reduce recidivism rates in youth they enroll in programming. When we review final reports from our grantees, we take a look at progress towards these objectives.
It should be said that we expect that some grants may miss their targets. There can be important lessons to draw from grants that go less than swimmingly. What assumptions were disproven? How did unexpected environmental factors come into play It is also worth noting that Tower Foundation Program Officers are scoring grants from their own grant portfolios, so this is not a completely unbiased process.
Overall Results
This pie chart shows what we found for the 44 grants that we scored.
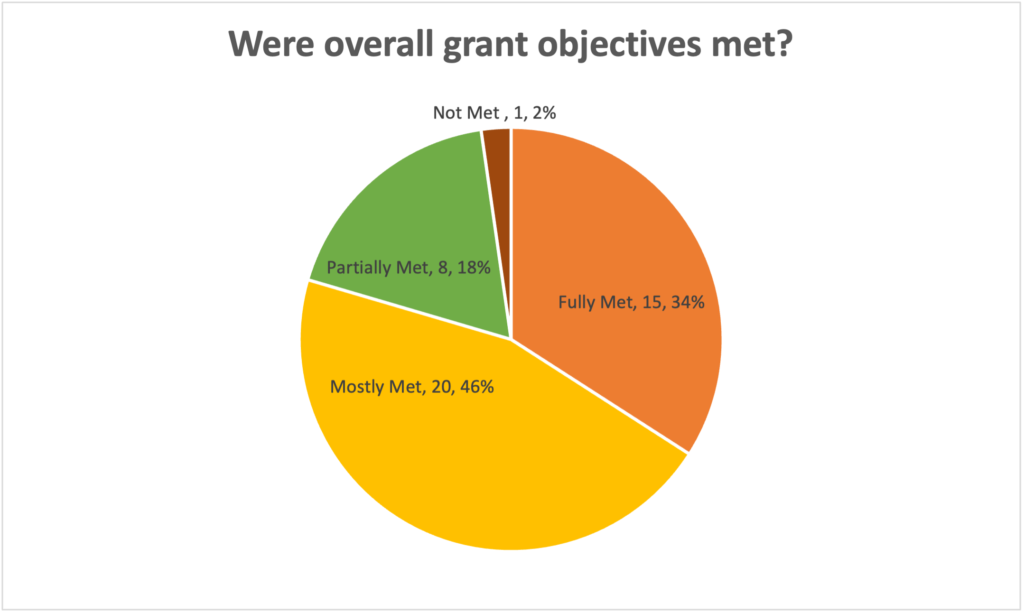
What did we see from these 44 recent grants? Eighty percent of the grants met their objectives, either in full (34%) or mostly (46%). Twenty percent fell quite short of meeting expectations: partially met (18%), not met at all (2%). Grants were fairly representative of our funding geographies and focus areas. About half were from Western New York and half from Eastern Massachusetts.
The 35 grants (80%) that either fully or mostly met their objectives represented a decline from previous assessments. In 2019 it was 91%, 94% in 2018, and in 2016 it was 95% that met the largely successful mark. We expect that the drop off is due, at least in part, to post-Covid realities. Nonprofit staffing resources took a hit, with very real challenges relating to turnover, remote v. in-person dynamics, and workforce shortages. Organizations retracted; fewer resources were allocated to new projects. Finally, clients/patients were slow to return to in-person engagements.
Success and Failure Drivers
Program Officers were asked to identify characteristics of the more successful grants (“success drivers”). Some of the recurring themes are shown below, with multiple citations identified.
- Strong community partnerships (healthcare, early ed., local providers, state agencies) x13
- Effective family outreach and referral network x4
- Well-diversified referral network x3
- Low staff turnover and/or deep staffing bench x4
- Authentically capture youth voice x3
- Ability to pivot/modify strategy x4
- Stable leadership x3
- Peer mentoring/peer advocacy approaches x2
- Bilingual resources for parent engagement x2
We did the same for “failure drivers.” “Failure drivers” is something of a misnomer. These were not necessarily challenges that would sink a grant altogether, but might contribute to a downgrade from fully met to mostly met.
Some of these included:
- Workforce recruitment and retention challenges x4
- Low reimbursement rates/billing delays/insurance credentialling x4
- School partnerships that are provisional, not firm
- Recruitment/promotion for community education workshops proved more difficult than expected x2
- Data sharing and privacy issues
- Sober living provisions without strong supports
- Other funding sources limited
- Reliance on part-time staff
Grant Impact (Organization, Population, Field)
Program Officers also score grants on whether or not they make an impact on the organization, on the population that the grant is intended to serve, and on the field. Here’s what the first measure showed.
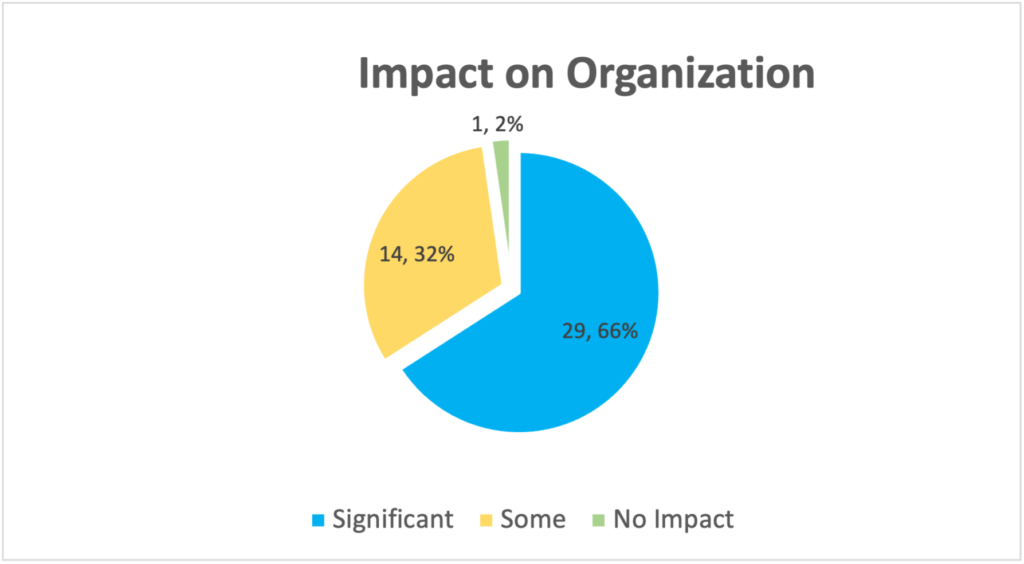
Grants with significant impact on the organization (66% of the grants we assessed) shared a lot of the characteristics that made a grant successful generally. Factors included strong partnerships and referral networks, stable leadership and staffing levels, attention to youth voice, and ability to adjust strategy.
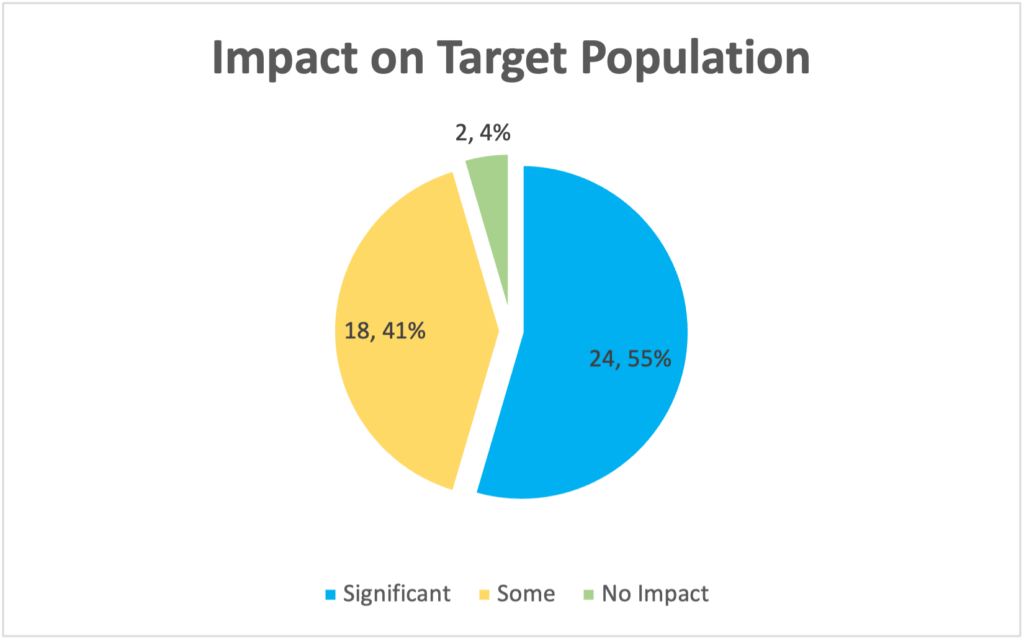
Many of these factors were also characteristic of grants with significant impact on the population they were intended to serve. Effective outreach and engagement of parents, school partnerships, and efforts to build community trust were also cited.
Finally, we looked at impact on the field level. It should be noted that grants in our Programs & Services portfolio primarily focus on service delivery and, as such, are not really expected to have field-level impact. Accordingly, we were pretty pleased to see field impact as high as it is, with significant impact at 20% and some impact at 55%.
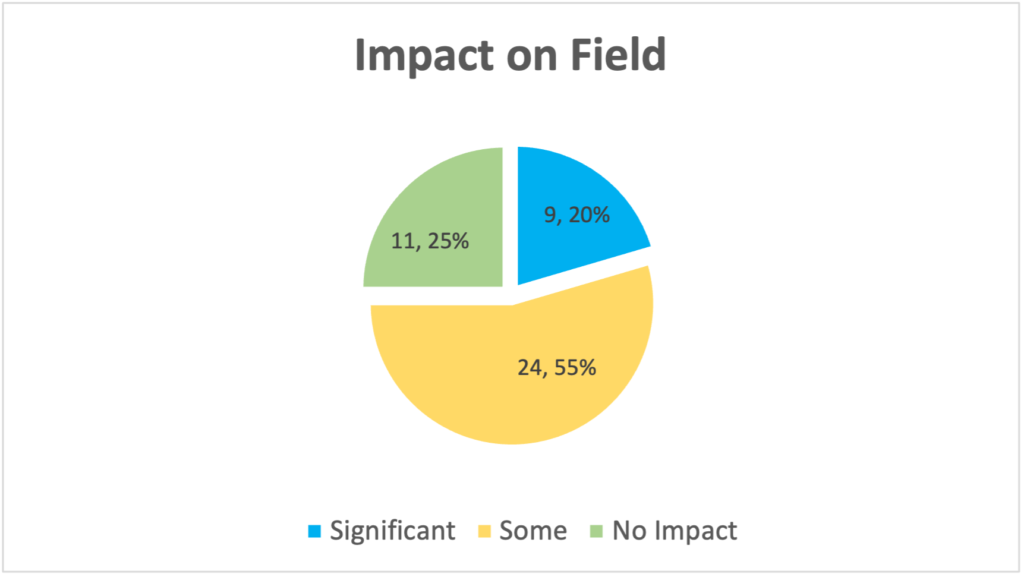
A few characteristics for this last measure stood out. Grants with significant impact at the field level paid attention to data collection and ways to evaluate/document effectiveness. Another factor cited several times was a sustainable source of funding (e.g., marijuana tax revenues or opioid settlement dollars).