


PART 1
[This installment of a two-part series looks at the performance of Tower grants when measured against specific project goals; Part 2 will look at the broader impact of the same grants.]
Every 18 months or so, we take a look at the latest cluster of closed grants and assess their aggregate effectiveness and impact.
So once again we ask the question: Are Tower grants effective? This time we looked at 47 grants that closed between June 2016 and May 2018. Since most of our grants are two- to three-year grants, this actually represents well over 100 years of programming/project time.
When a program officer closes out a grant, they complete an internal assessment form that we call “Lessons Learned.” Drawing on site visits, interim reports, final reports, and the relationships we build with grantees, we respond to this question: Were overall grant objectives met? We looked at the objectives that the grantee had described to us when they applied for funding. The scoring options include Fully Met, Mostly Met, Largely Unmet, Not Met At All.
Just to give you an example of what these objectives might look like: an agency may have identified the ability to offer a new intervention to 100 clients annually as a project objective, or to reduce recidivism rates in youth they enroll in programming. When we review final reports from our grantees, we take a look at progress towards these objectives.
It should be said that we fully expect that grants may miss their targets, sometimes widely. Maybe there is more to learn from these projects than from ones that go swimmingly from start to finish. What assumptions were disproven? How did unexpected environmental factors come into play? It is also worth noting that Tower program officers are scoring grants from their own grant portfolios, so this is not a completely unbiased process.
This pie chart shows what we found for the 47 grants that we scored.
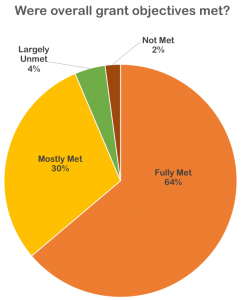
What did we see from these 47 recent grants? Ninety-four percent of the grants met their objectives, either in full (64%) or mostly (30%). Six percent fell fairly short of meeting expectations: largely unmet (4%), not met (2%).
[This tracks pretty closely with the last time we assessed grant impact when we saw fully met at 73%, mostly met at 23%, and largely unmet at 4%.]
As previously, we looked first at failure drivers, the factors/conditions that contributed to grants underperforming. A few critical failure drivers emerged.
-
- Families may not be comfortable engaging in dialogues about mental health in larger group and community settings.
Alignment of project objectives among partners was not solid. In one example, one partner felt that the project was partly about increasing outreach to families, while another partner felt they were already doing enough. - Partners entered a relationship cold, with no prior knowledge of each other and little relationship building.
- Implication of financial issues under-estimated. Due to budget crunch, school district unwilling to support any costs for a vocational skills program.
- Poor feedback loop from clients. Parent input sporadically collected.
- Bad timing. Major environmental distractions (e.g., Medicaid reform) proved a big distraction.
- Twice there was a disconnect between development staff and staff that had to run the project. The project team was basically handed a work plan of which they had little ownership.
- Leadership turnover translates to loss of a program champion, particularly if a program is not revenue generating.
- Three or more times we heard that IT system modifications, sometimes mission critical ones like Electronic Medical Record integration, took longer than anticipated or did not function as hoped.
- Family engagement numbers lag expectation.
- Recruitment – whether for volunteers, experimental subjects, or new hires – generally more challenging than anticipated.
- Staff turnover was cited by four grantees as a particular challenge.
- Families may not be comfortable engaging in dialogues about mental health in larger group and community settings.
We also wanted to look at what made projects successful. Here are some of the “success drivers” we identified for projects that fully or mostly met objectives.
- Committed program leadership (cited 2x).
- Strong university partnership (cited 3x) translates to access to resources and name recognition in the community.
- Trauma training that is agency-wide.
- Quality project team, together for a long-time, providing continuity (cited 2x).
- Focus on getting a really good trainer – do your homework (cited 2x). And use qualified trainer for refresher training.
- Strong project management that is open to work plan adjustments, accessible, and transparent about challenges and program change (cited 3x).
- Strong planning, with program and culture change readiness in place and at the center of attention.
- Offer a training certification that potential trainees currently need, based on timely state requirements.
- Schedule events at consistent times and advertise consistently. Good event promotion includes user-friendly, on-line registration.
- Excellence and commitment in recruiting, training, and supporting volunteers.
- With parent engagement, keep at it and try different messages, different communication strategies. Be patient, but persistent.
So what do we do with this information? We know we want to capture the stories (and the learning) that our grantee partnerships tell us. When we work with prospective grantees or review grant proposals, we look for program designs that can harness success drivers. And, from the failure drivers, we know to caution grantees about the common pitfalls in both planning and execution.
In Part 2, we look at the broader impact of our grants. Do they have a pronounced, positive effect on the target population served, the strength of the organization, or the field as a whole?
Photo by tripplehelix | creative commons 2.0 licensed